
In today’s digital landscape, presenting data in a visually appealing way is essential for engaging your audience. The Simple Chart block for WordPress offers a straightforward solution for adding effective data visualizations to your site, making it easier to showcase important information without requiring extensive coding skills.
What is Simple Chart?
The Simple Chart block is a user-friendly Gutenberg block designed to create various types of charts, including bar, line, pie, and doughnut charts. Built using Chart.js, a powerful JavaScript library for charting, this block enables you to input data, customize colors, and add titles effortlessly.
Key Features
- Multiple Chart Types: Select from bar, line, pie, and doughnut charts based on your data needs.
- Customizable Labels and Data: Input labels and data directly in the block editor for seamless editing.
- Color Selection: Easily assign different colors to your data points.
- Dynamic Titles: Add and customize titles for your charts to provide context.
- Responsive Design: Ensure your charts look great on all devices.
Getting Started
Installation
To use the Simple Chart block, follow these steps:
- Install the Plugin: Download and install the Simple Chart plugin from the WordPress plugin repository.
- Activate the Plugin: Activate the plugin through your WordPress admin dashboard.
- Add the Simple Chart Block: In the post or page editor, click on the “+” icon to add a new block and search for “Simple Chart.”
Creating Your First Chart
- Select the Chart Type: Choose the desired chart type from the dropdown menu.
- Input Labels: Enter labels as a comma-separated list.
- Enter Data: Input your data points, also separated by commas.
- Customize Colors: Select colors for each data point with a simple click.
- Add a Title: Optionally, include a title to contextualize your chart.
- Preview Your Chart: The chart renders in real-time as you input your data.
Example Usage
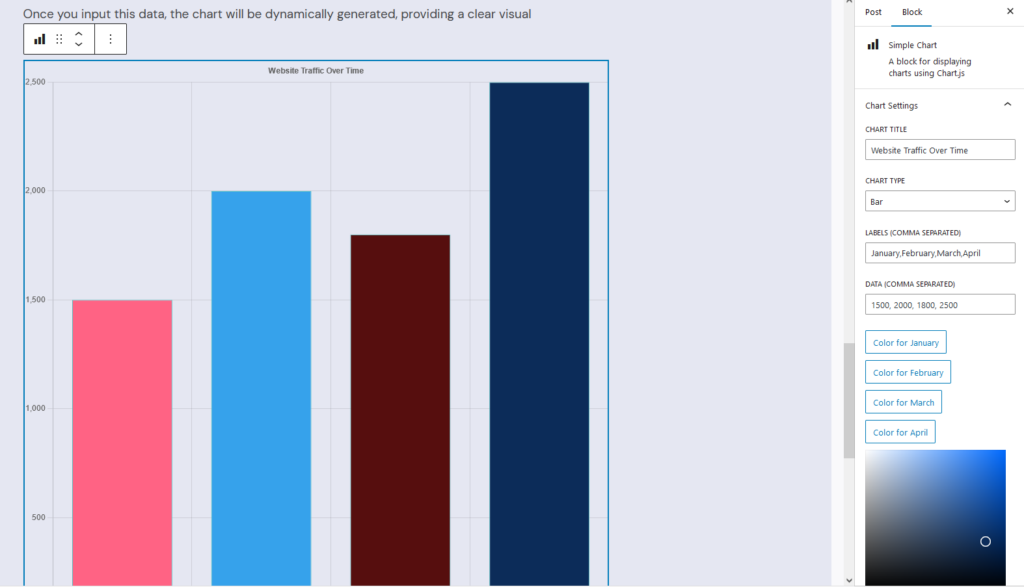
For instance, if you want to illustrate your website traffic over the last four months, you could set up a bar chart with the following:
- Chart Type: Bar
- Labels: January, February, March, April
- Data: 1500, 2000, 1800, 2500
- Title: Website Traffic Over Time
Once you input this data, the chart will be dynamically generated, providing a clear visual representation.
Conclusion
The Simple Chart block is an effective way to add data visualization to your WordPress site with minimal effort. By leveraging Chart.js, it combines ease of use with powerful features, making it accessible for everyone, regardless of technical expertise.
Start using the Simple Chart block today and enhance your content with clear, engaging visual data!
For any questions or feedback, feel free to leave a comment below!